With Social Champ’s Analytics feature, you can analyze your different social accounts and their posts for audience, engagement, impressions, and brand awareness. Furthermore, you can access detailed individual graphs and top posts for major social accounts and repost them with a single click. You can also graphically compare your data and generate PDF, PPT, or CSV reports.
Follow this step-by-step tutorial to learn how!
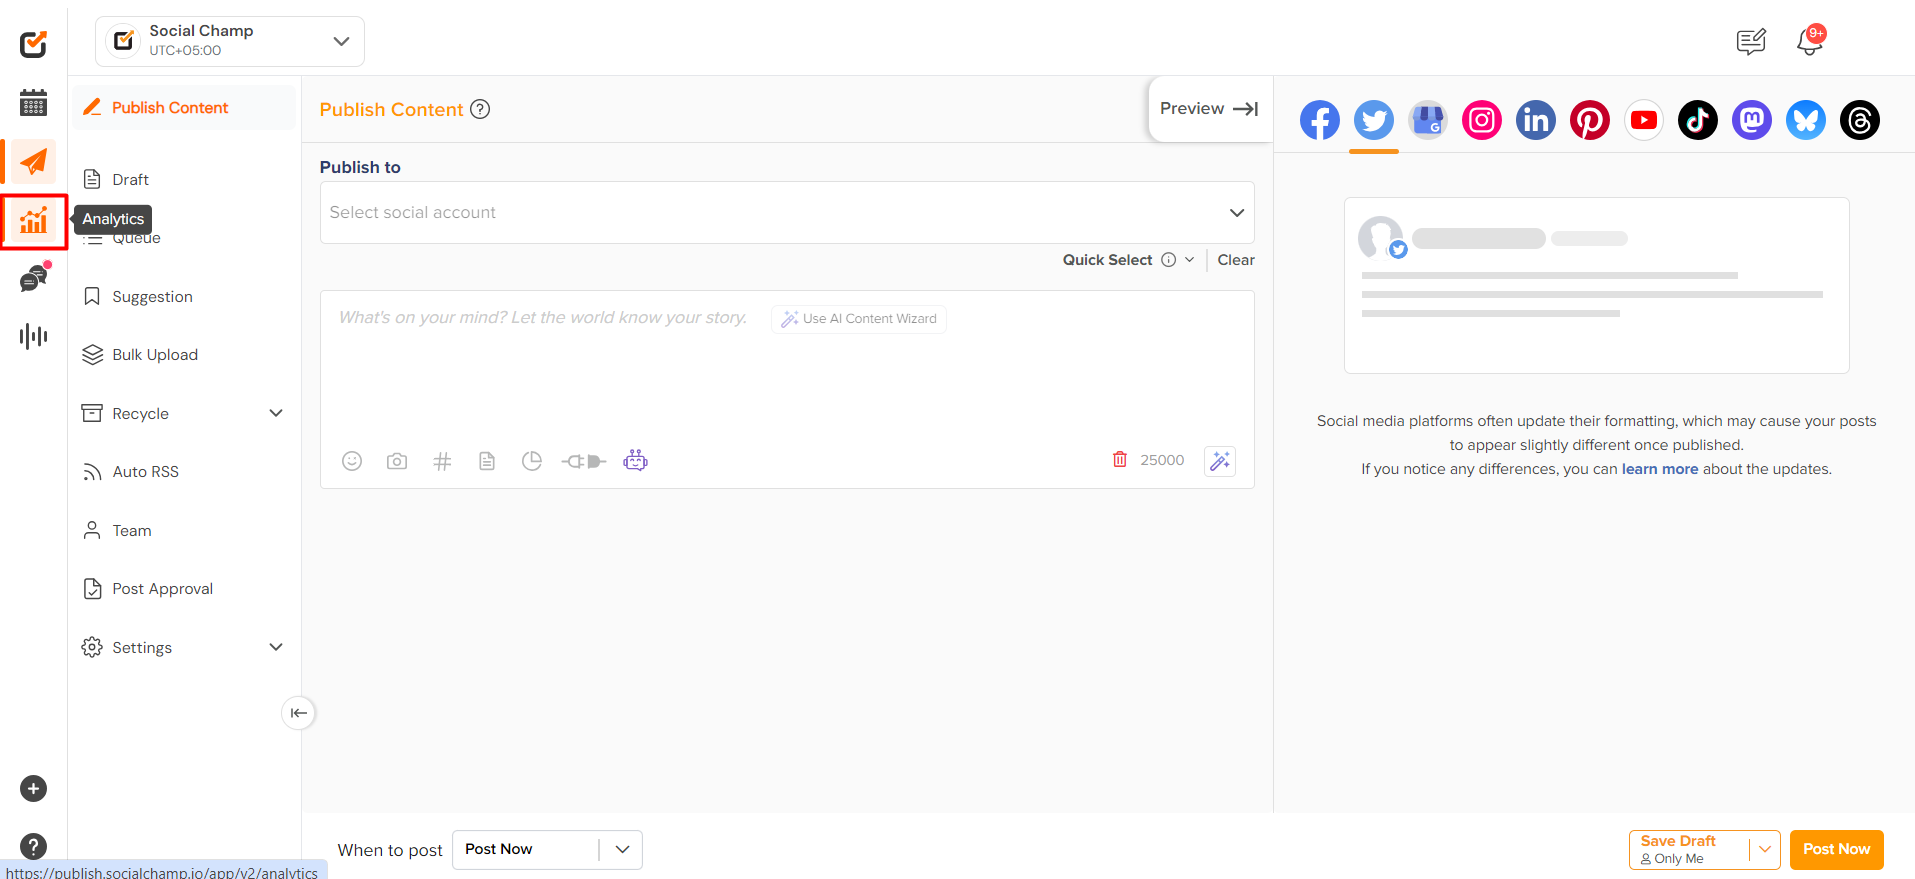
- Simply log in from your Social Champ’s account and select Analytics from the extreme left column.
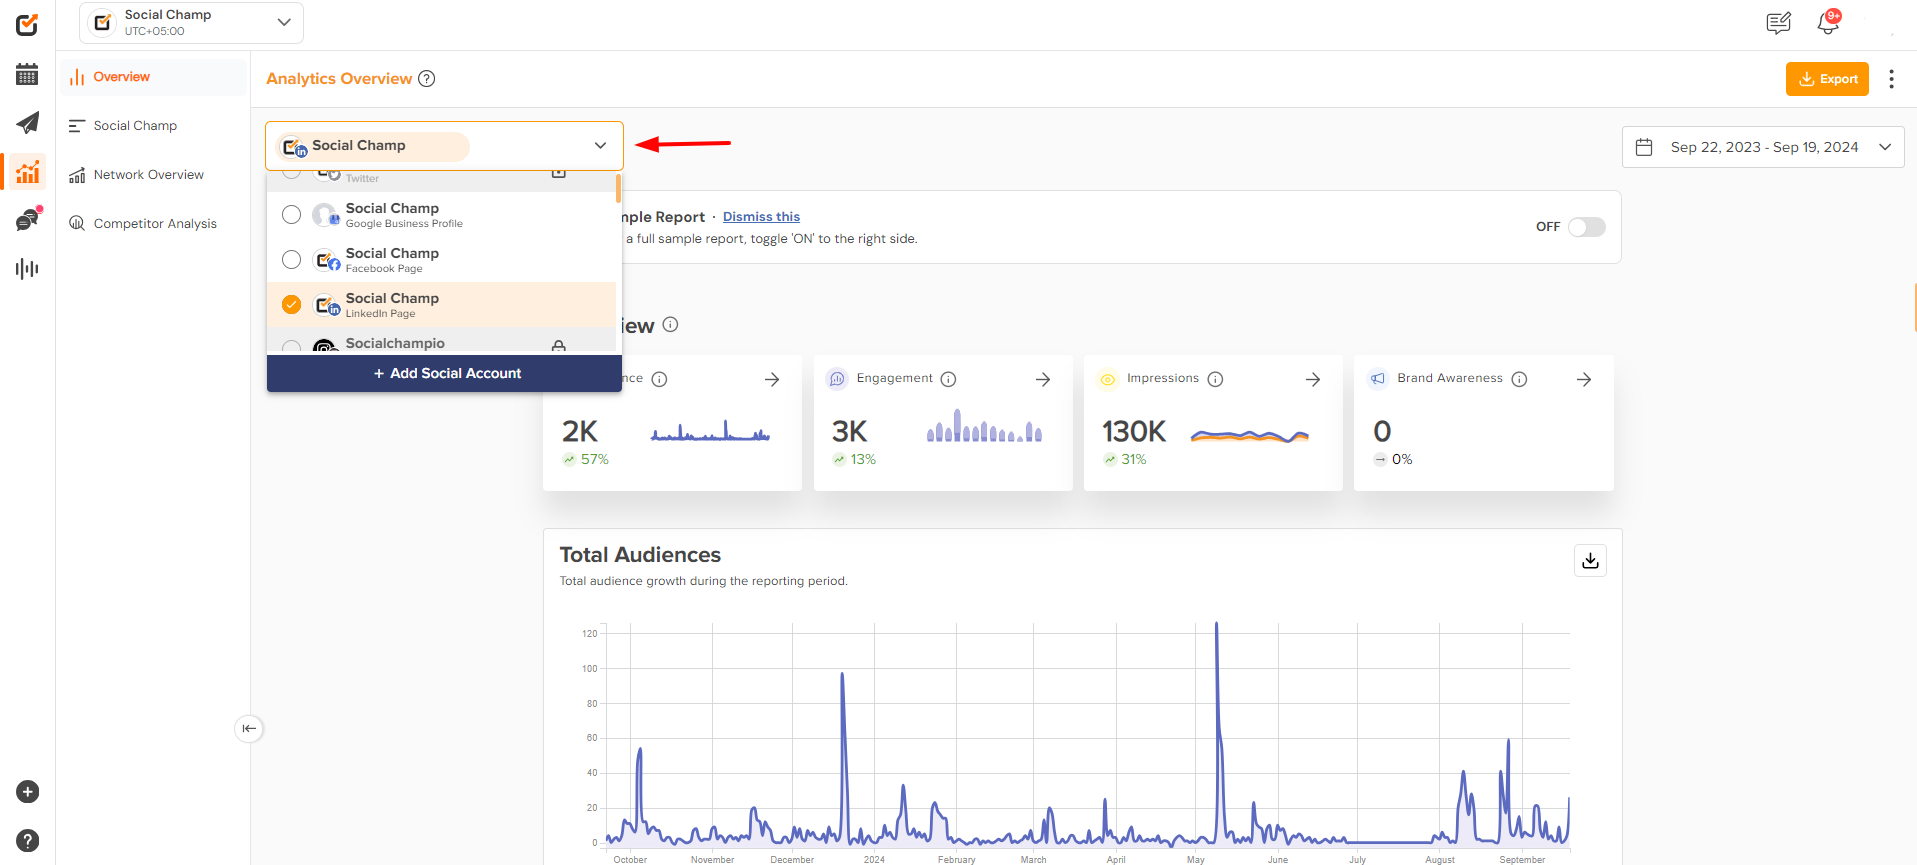
- Select the desired account from the dropdown above and allow the analytics to load.
P.S Analytics for Twitter, LinkedIn Profile, and personal Instagram accounts are not supported due to API Limitations.
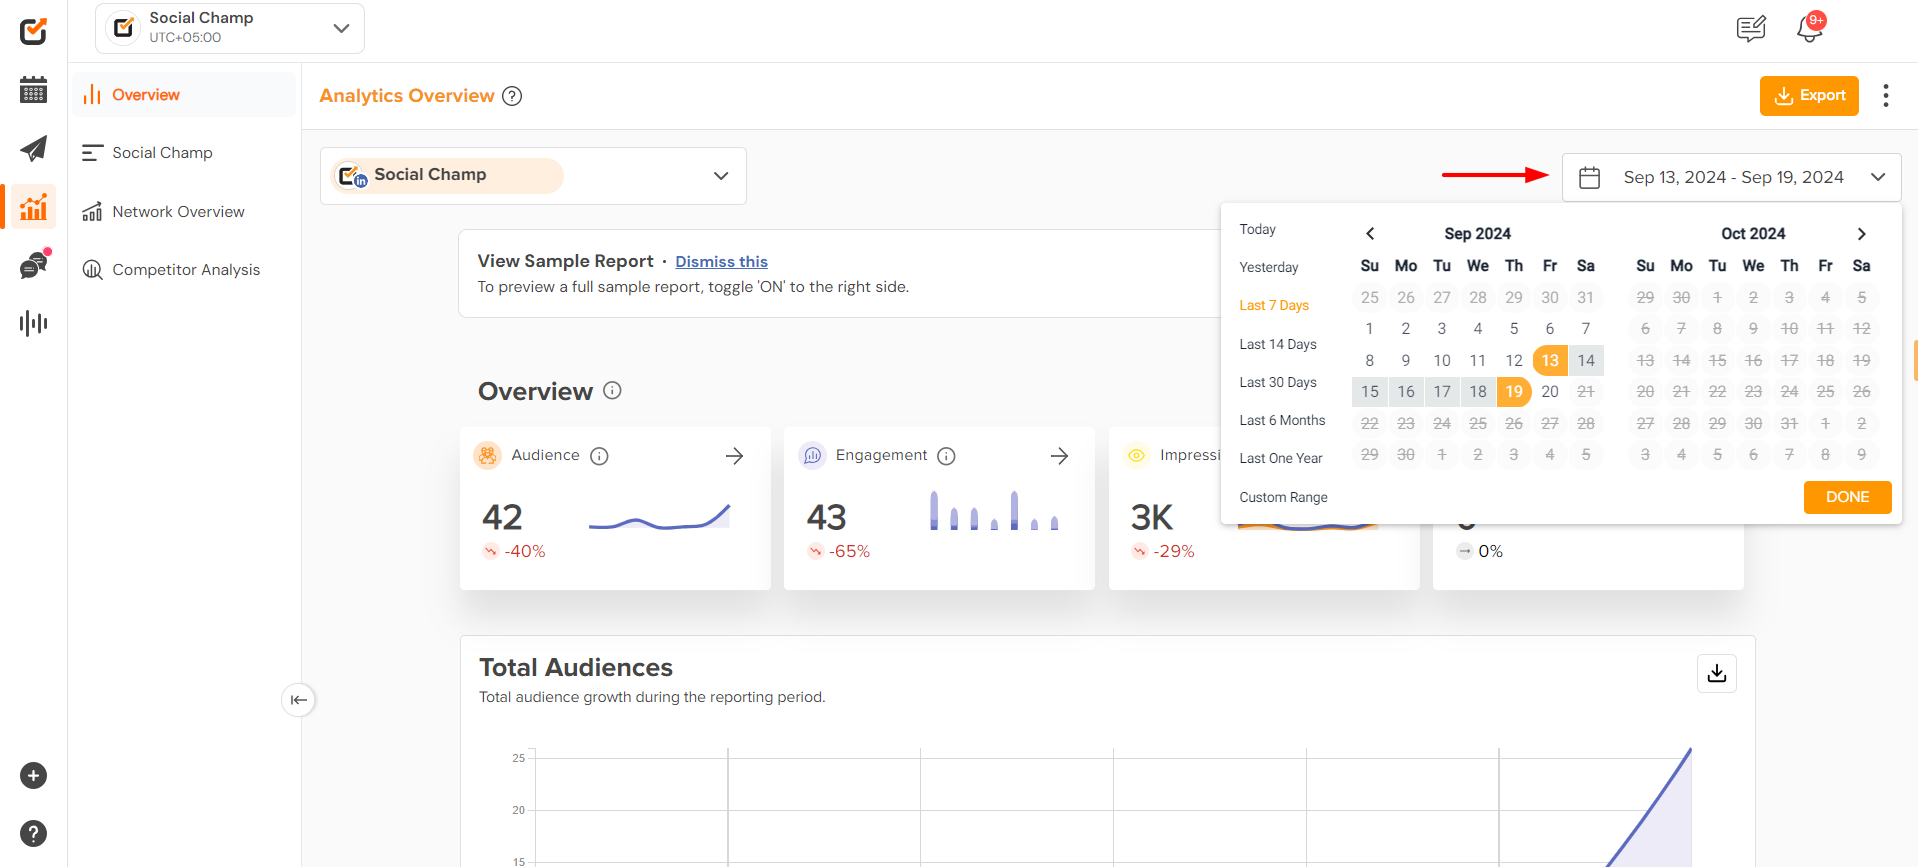
- Choose a date range from the right dropdown from yesterday, last 7 days, last 30 days, last 6 months, last year, or a custom date range for the data flow.
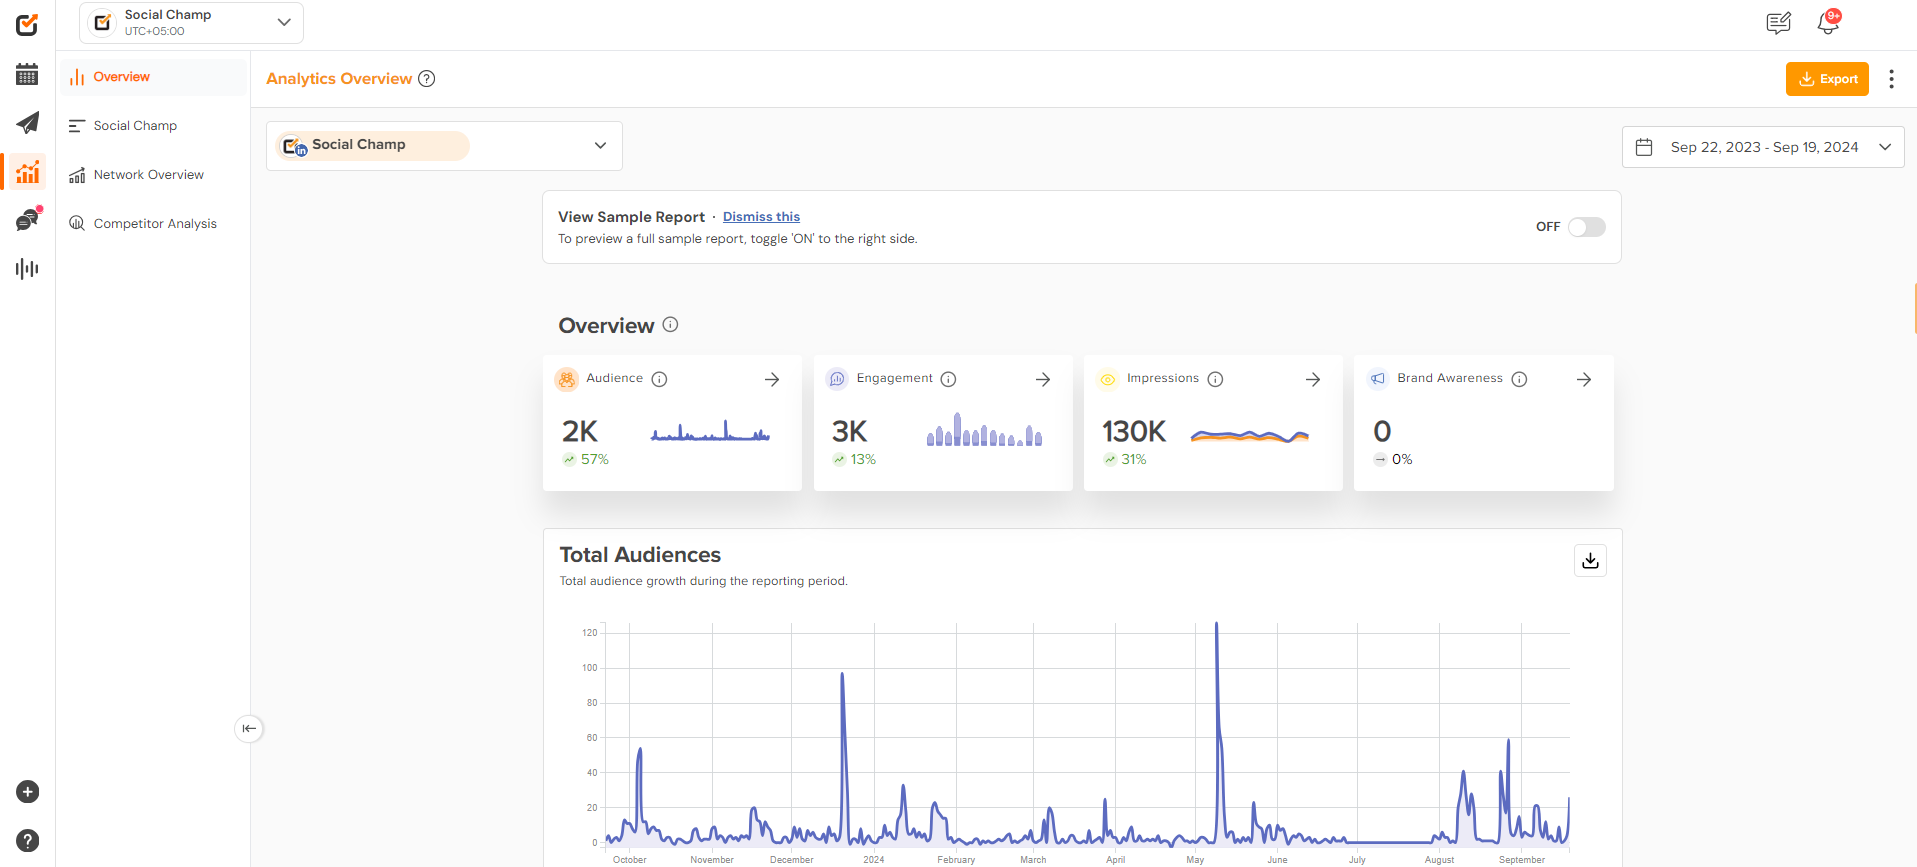
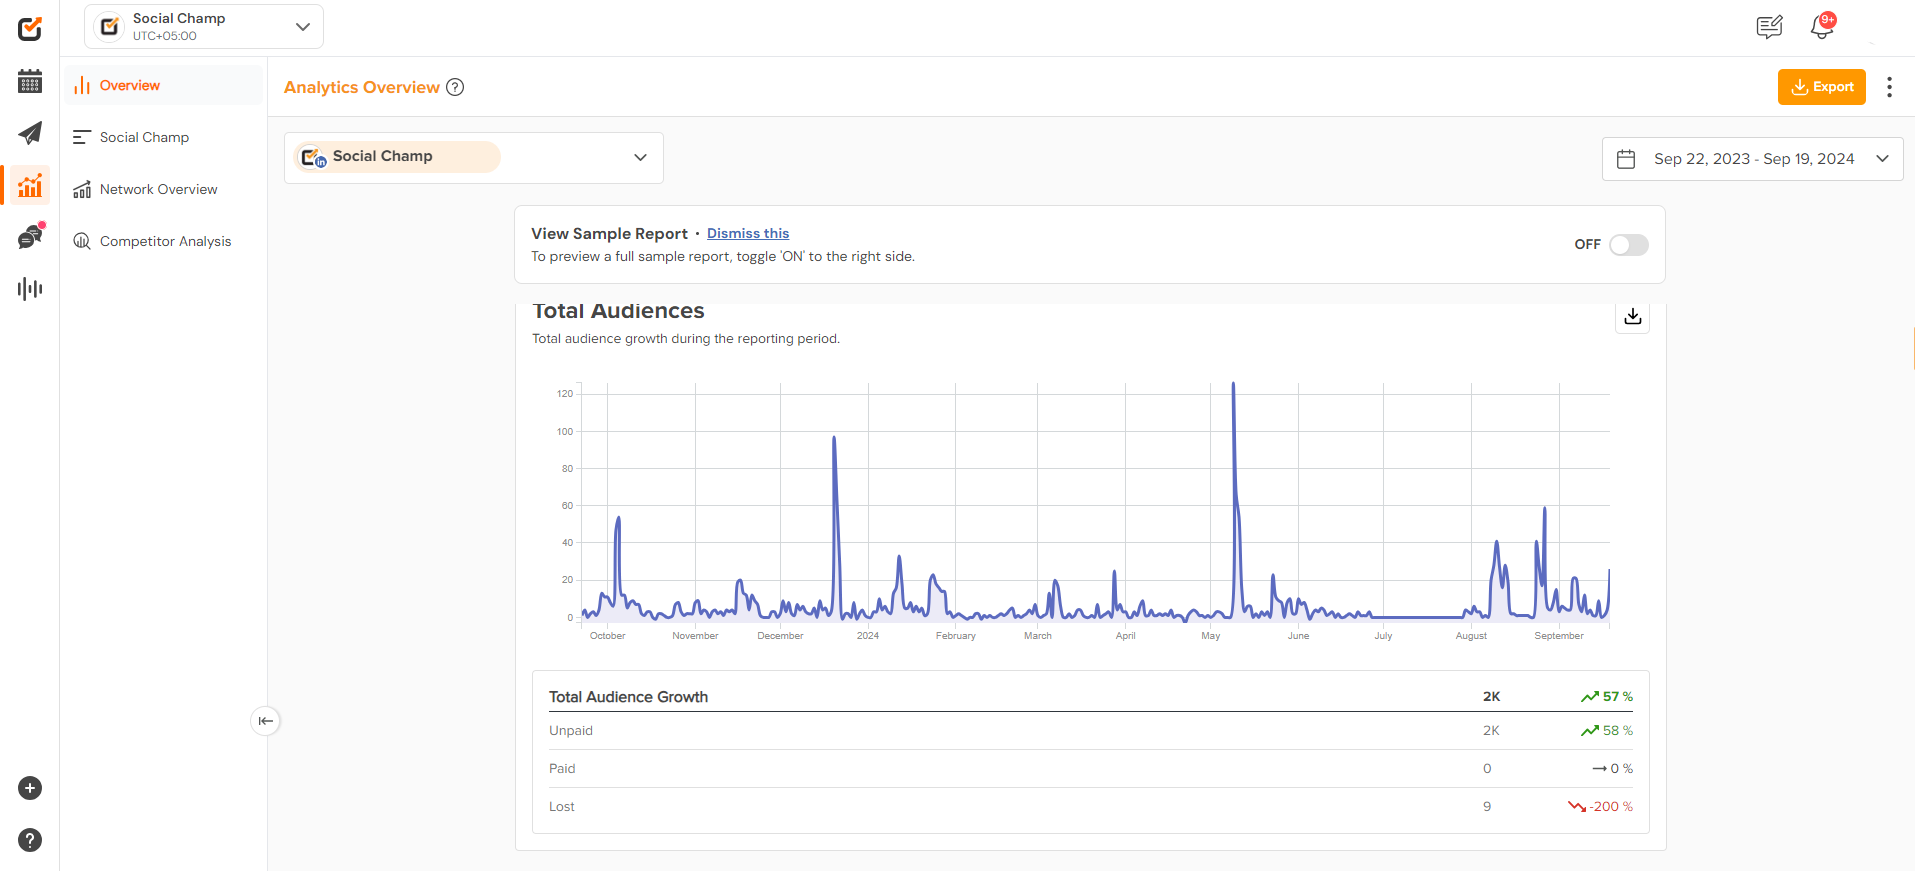
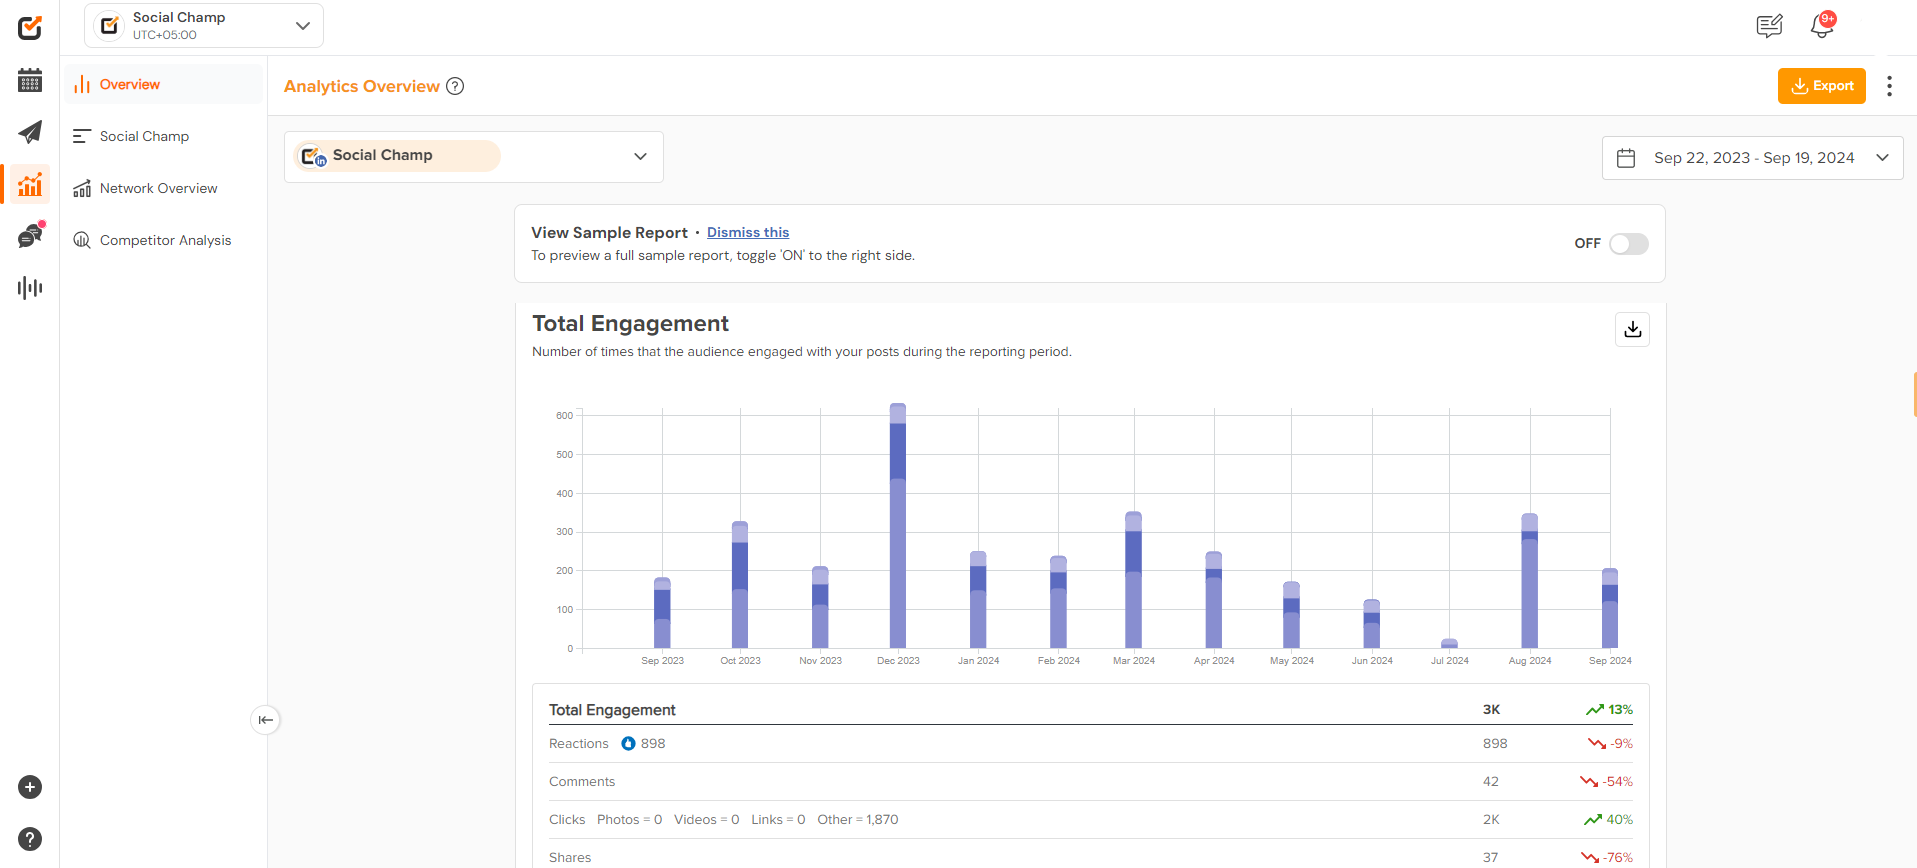
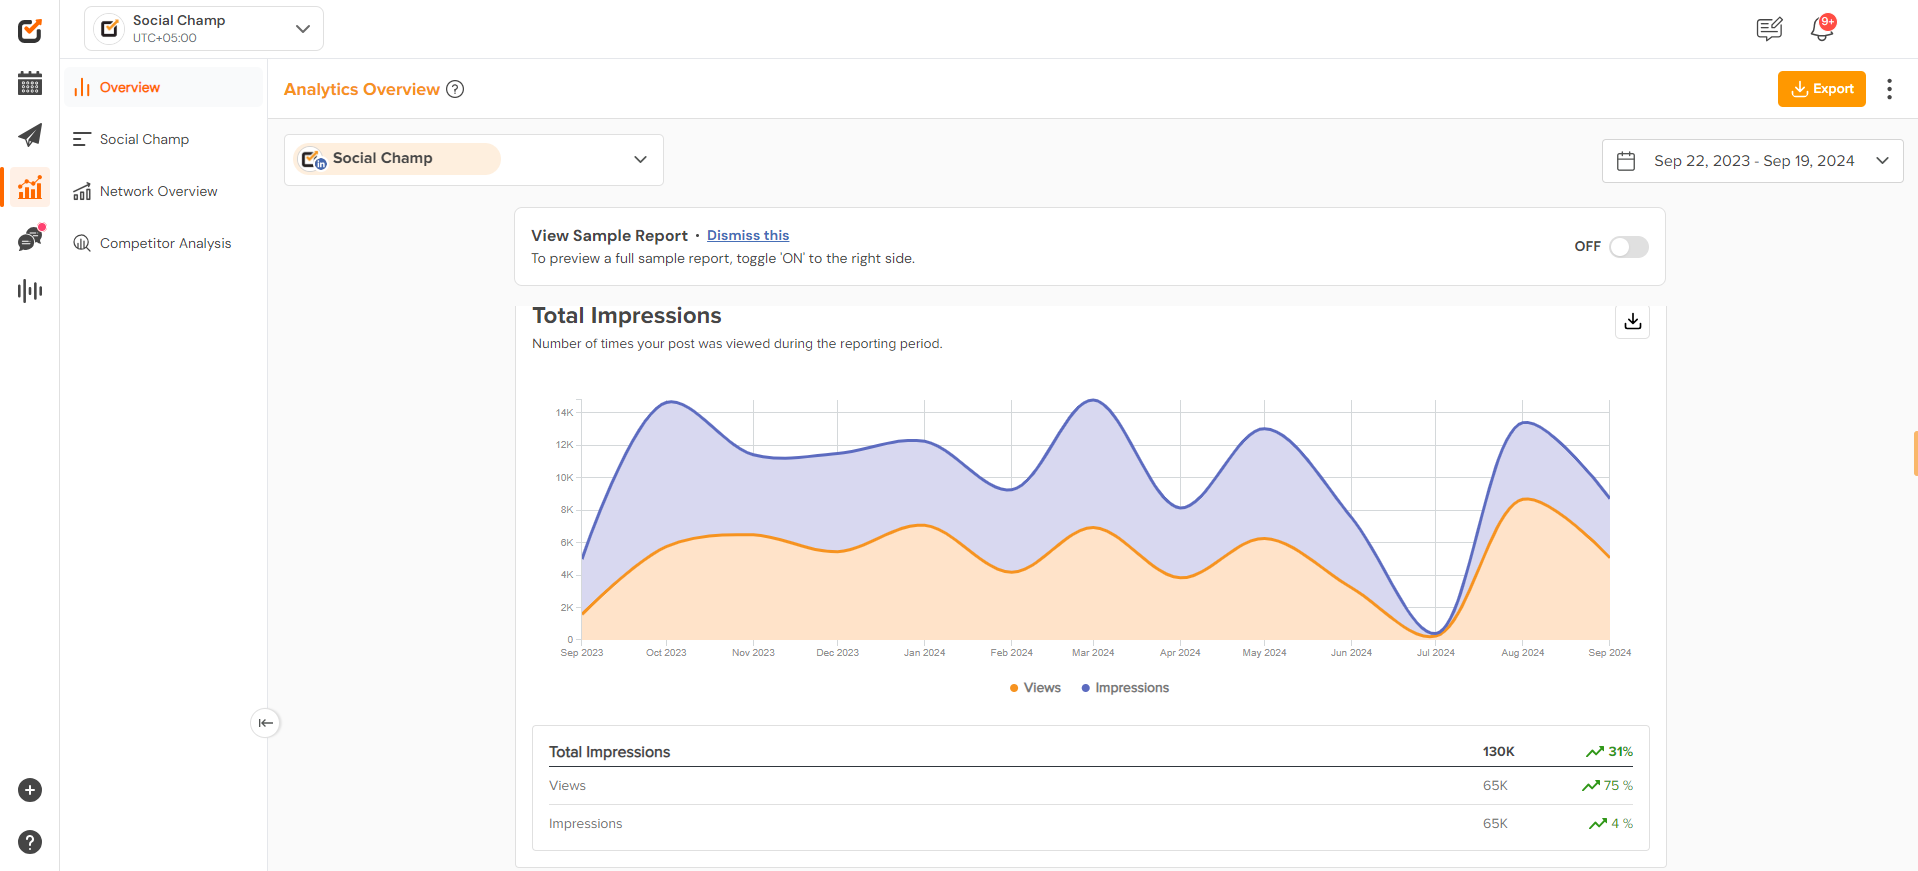
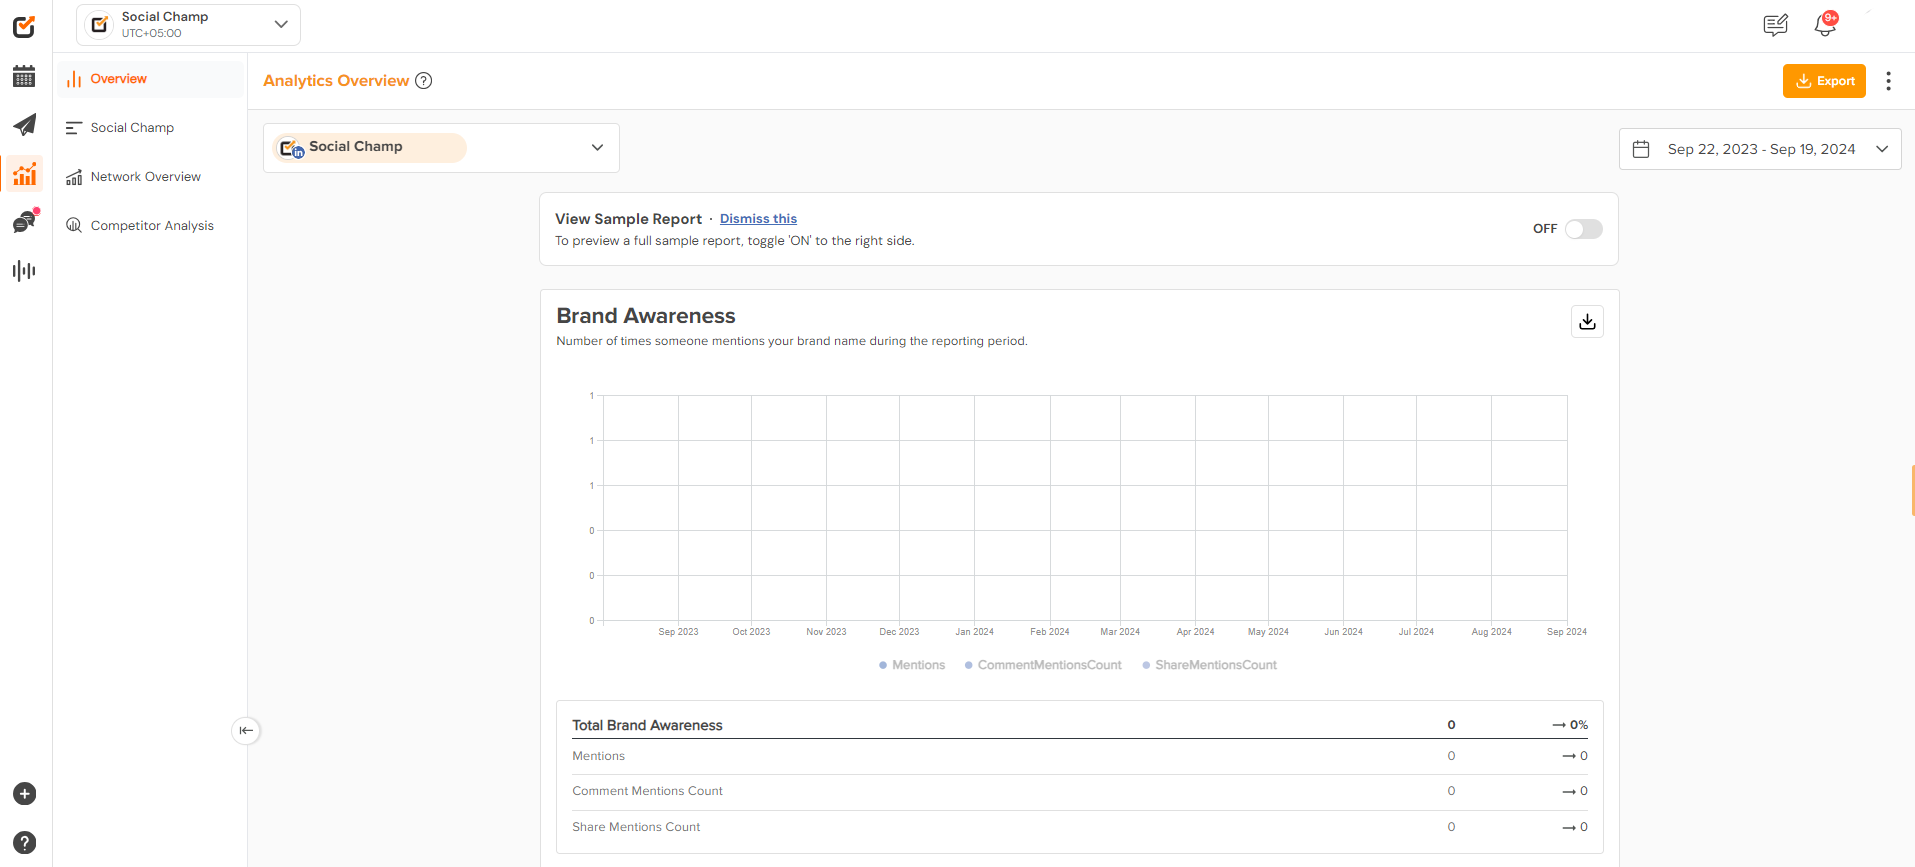
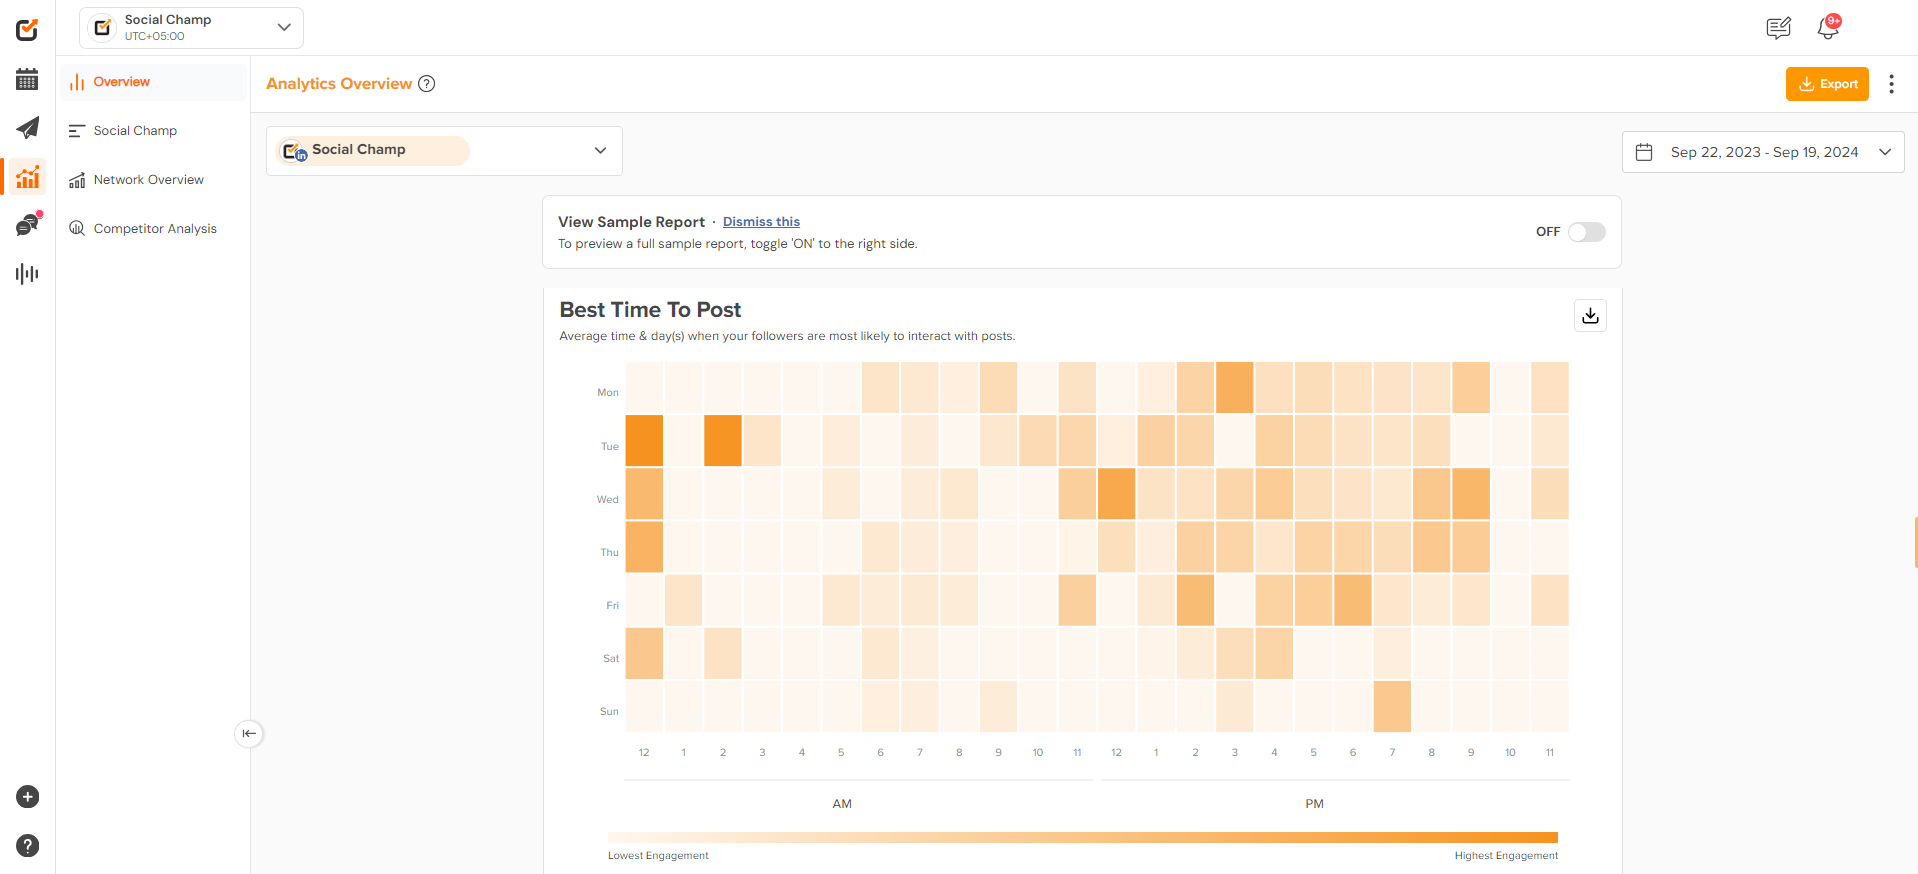
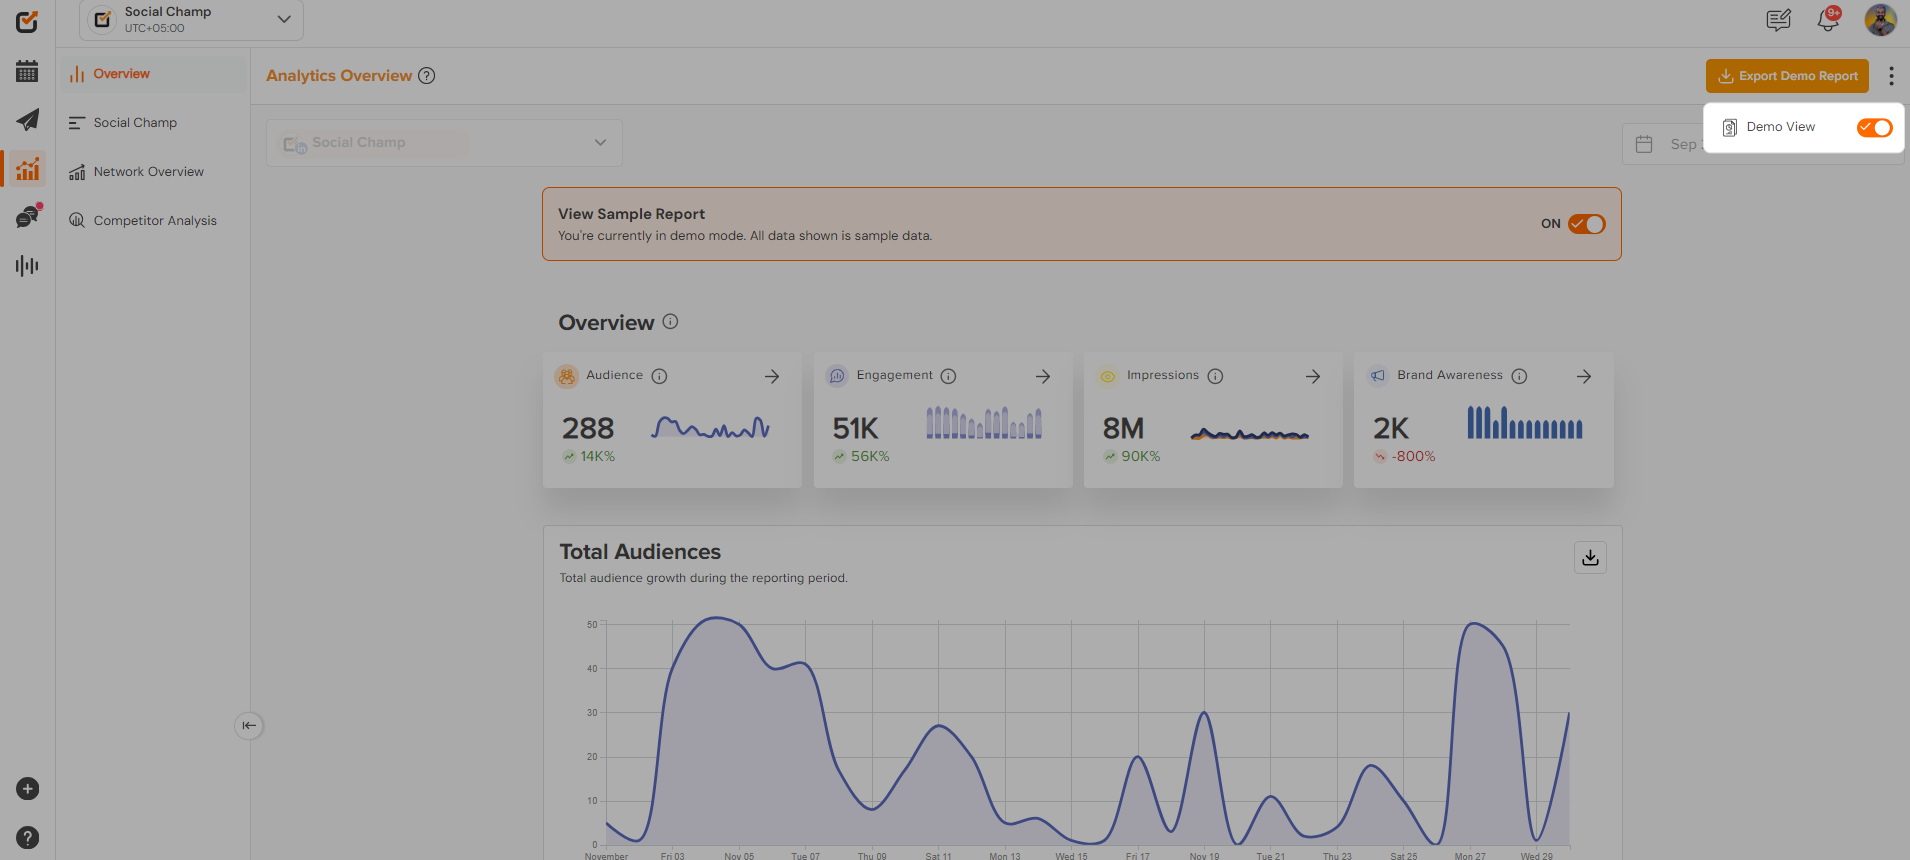
- The data will be presented in beautiful graphs for four significant metrics: Audience, Engagement, Impressions, and Brand Awareness.
- You can check the ideal posting time based on a selected date when your followers will most likely engage with your posts from the Best Time To Post widget.
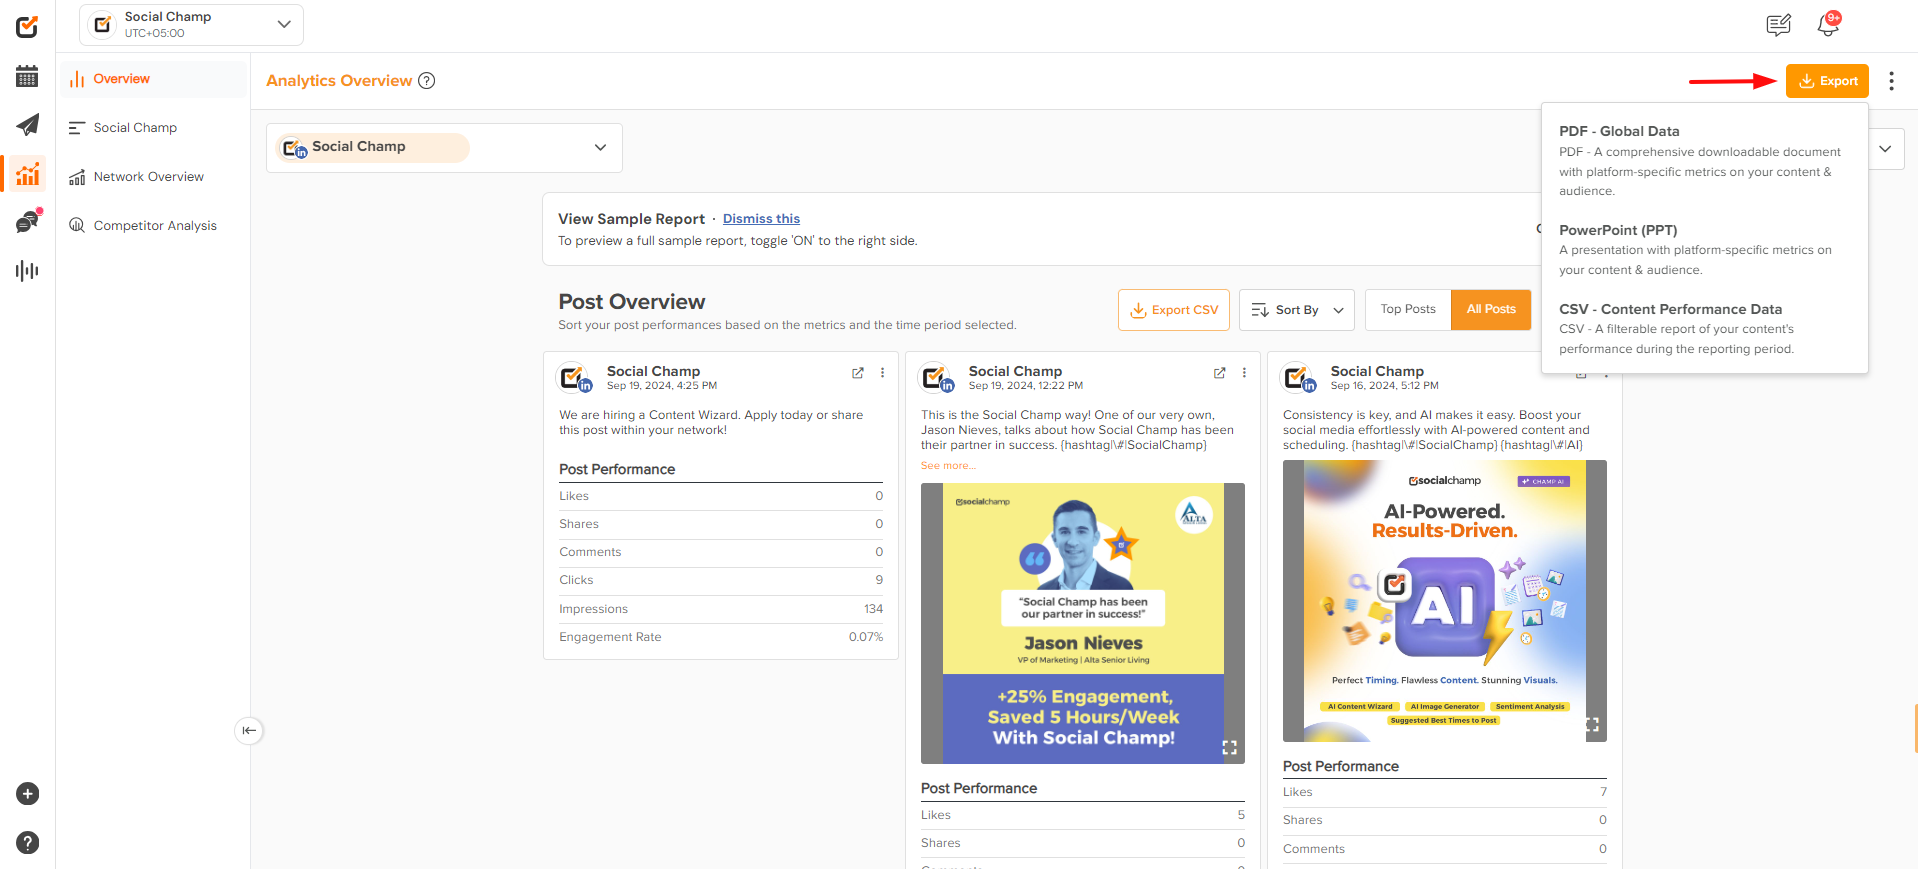
- Under the’ Post Overview’ widget, you can track your posts’ performances based on the chosen metrics and the time period. Post Overview can be sorted by engaged users, clicks, reach, engagements, reactions, comments, shares, other post clicks, video views, and video time.

- Click the ‘Export’ button on the window’s top right corner to export data as white-labeled reports in a PDF, PPT, or CSV format.
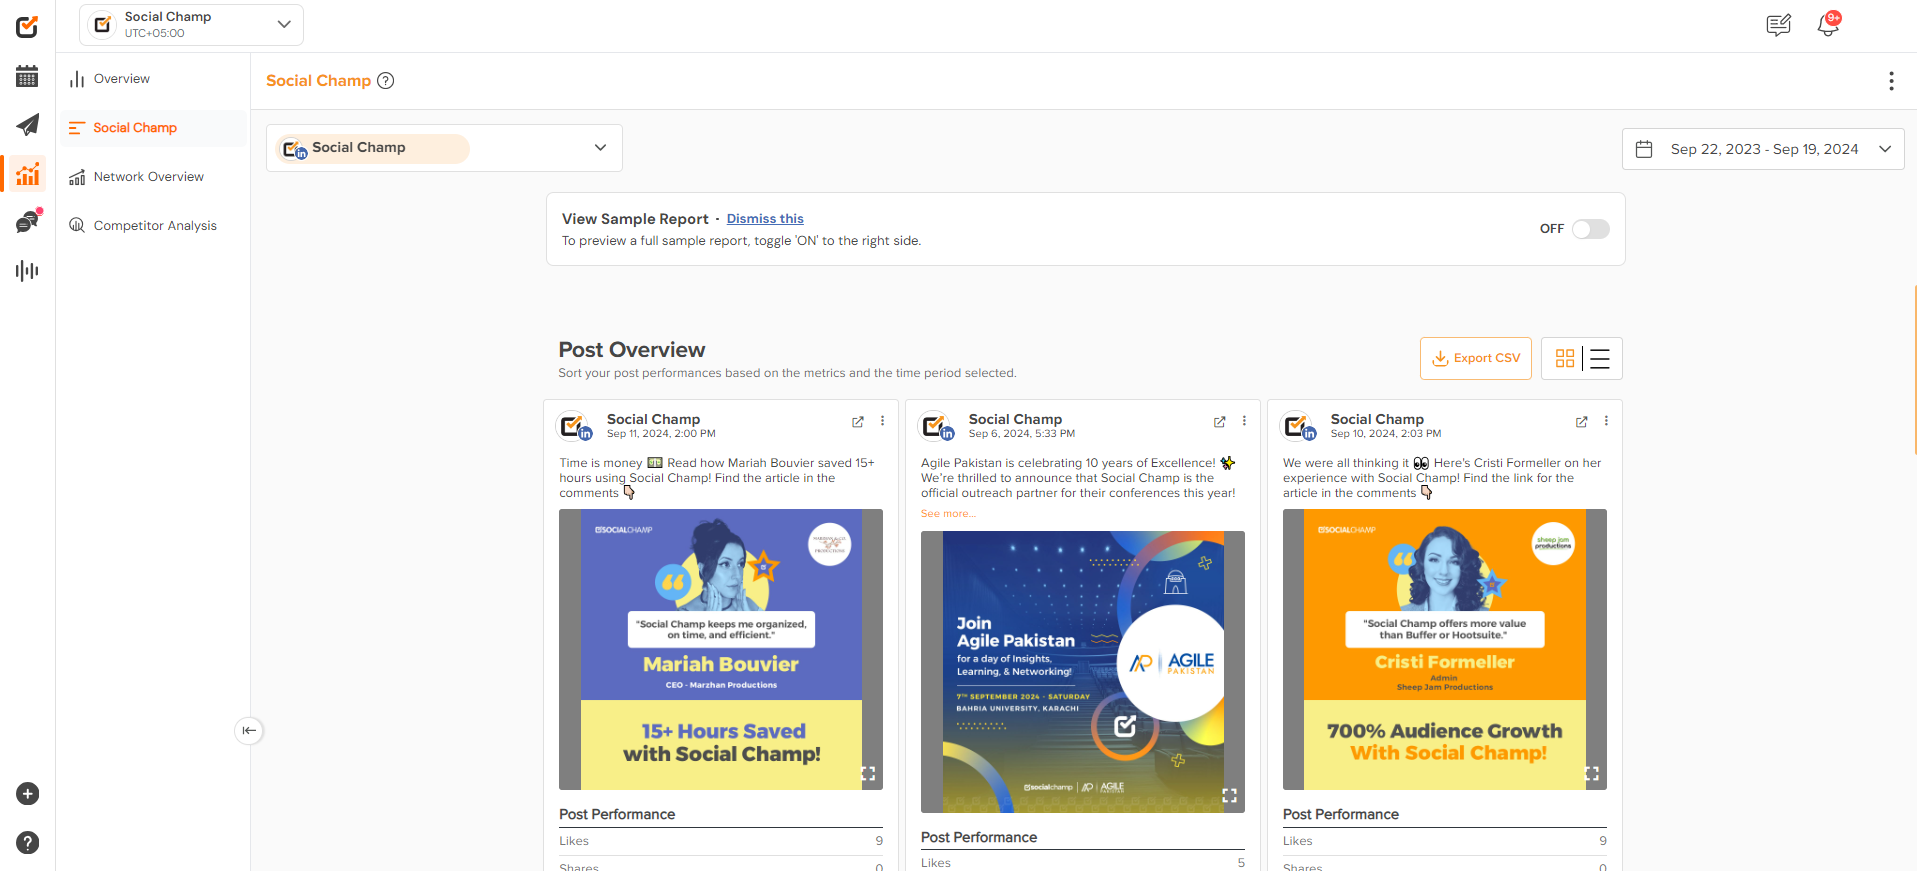
- With the Social Champ option on the left panel, you can access all your posts scheduled and posted via Social Champ. View detailed insights and repost posts in a click.
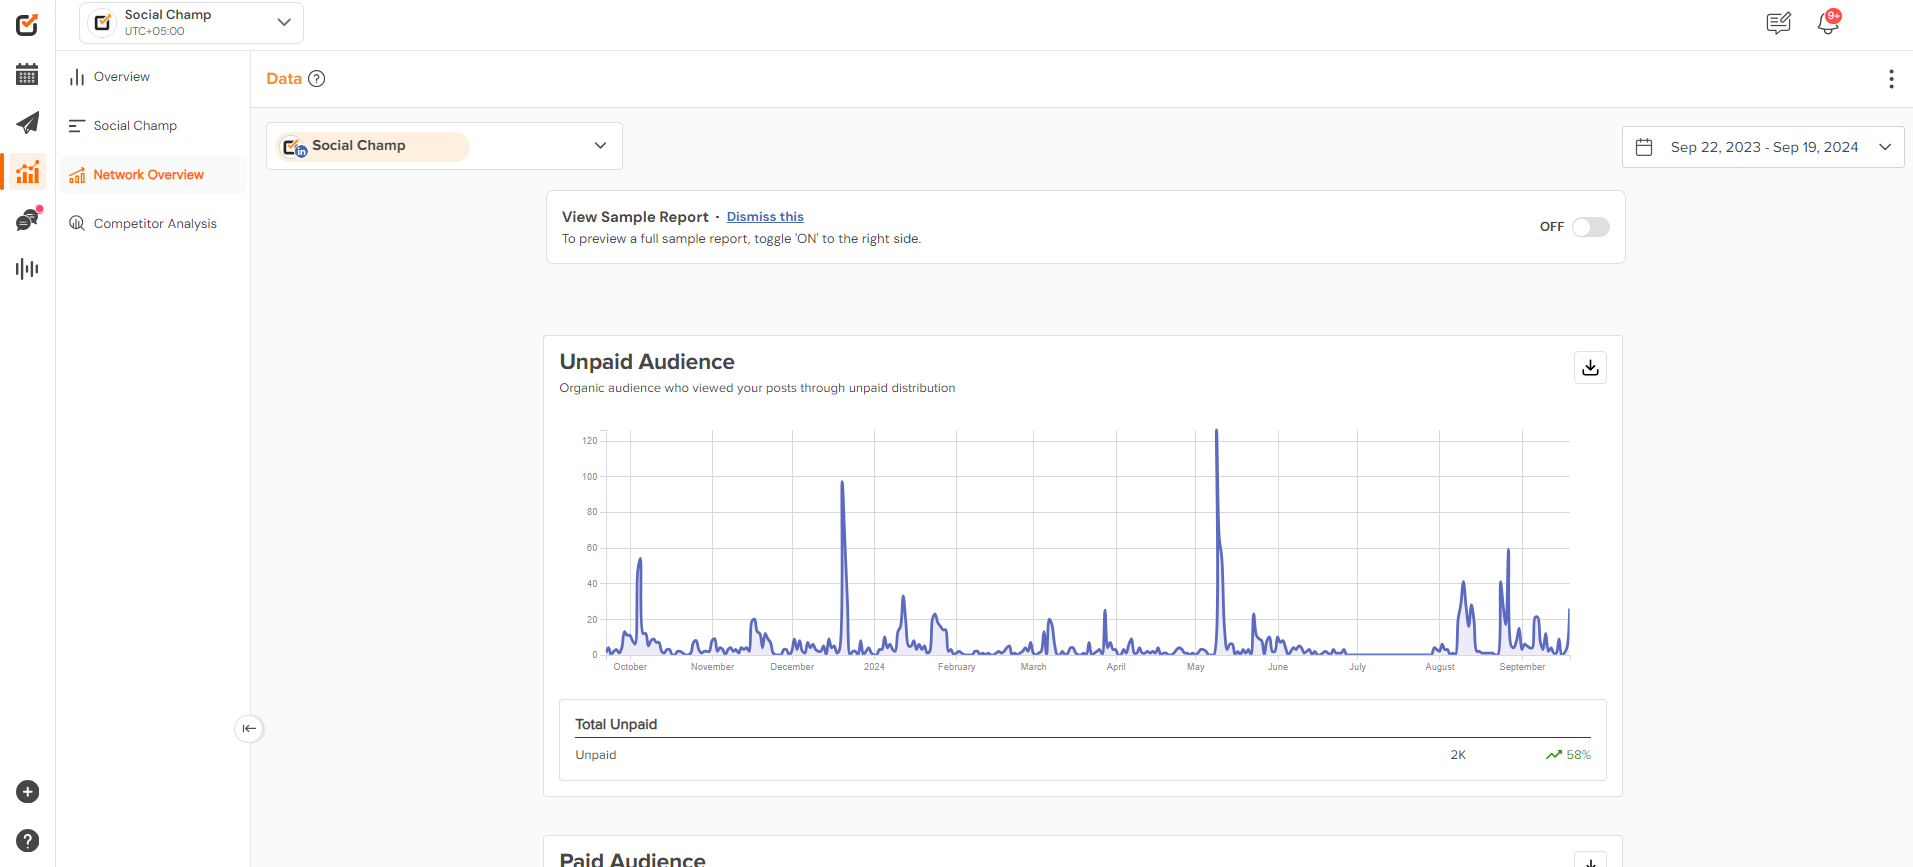
- To view detailed data metrics, you can opt for Individual Analytics, select the desired account from the dropdown above, and let the analytics load.
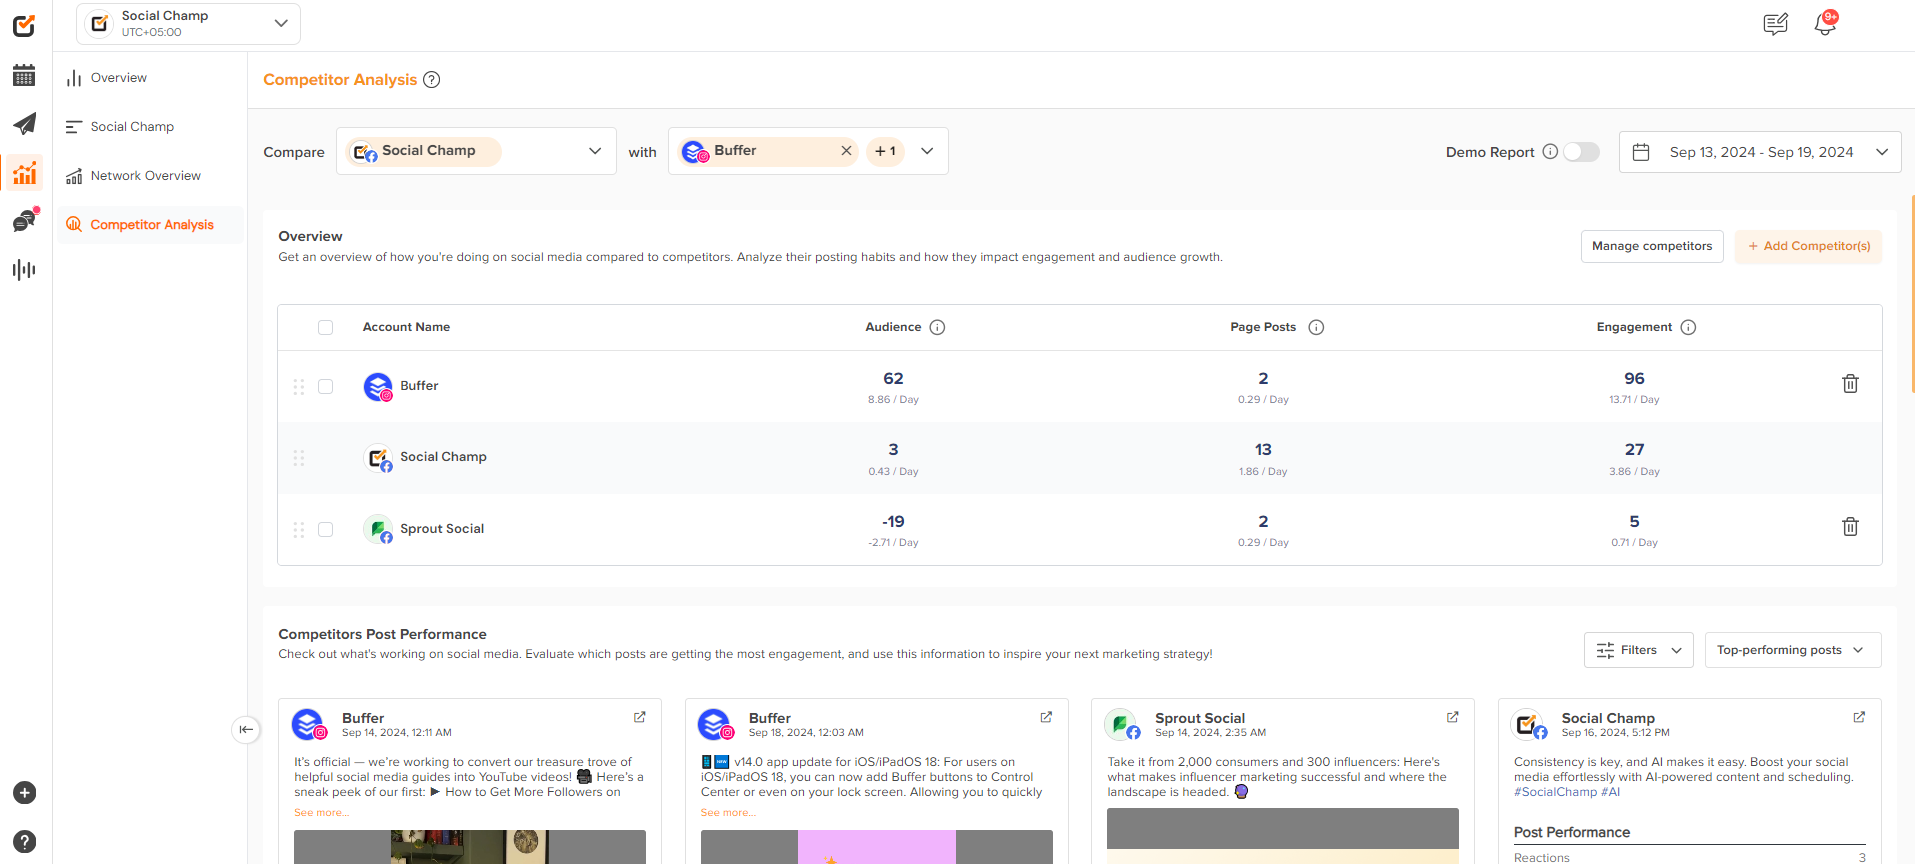
- Competitor’s Analysis tab gives you an access to the competitor’s world, here you can analyze your competitor’s posts and Engagement and compare it with your account. Click here to know how does it work.
To view a demo report, simply toggle the switch located above the Analytics report or use the drop-down menu in the top right corner. This feature allows you to explore all key metrics, even if your social media account doesn’t have the necessary data yet. It’s a great way to get familiar with the insights you’ll be able to access!
Note: Due to API limitations, the Analytics report is not available for the LinkedIn personal, Twitter, and Mastodon.
Great work! Now you’re all set to analyze your social media performance with the Analytics report. Keep in mind, reports may vary across accounts, so dive in and explore how you can track your posts, engagement, and other key metrics. Visit now and take your social media strategy to the next level!
Social Champ allows users to track Analytics and insights for their respective social accounts. Measure post performances based on major Read more
Hey Champs! Social Champ allows you to track the performance of campaigns and content via its In-app UTM tracking feature. Read more
Social Champ’s feature, “Best Time To Post,” enables you to optimize post-scheduling by analyzing the performance of your previously published Read more
Competitor Analysis is a powerful feature in Social Champ designed to provide you with insights into your competitors' social media Read more